Understanding Impeller Specific Speed, and the Relationship Between Wear Ring Clearance and Efficiency
In every field, there are design numbers which indicate certain performance characteristics. For example, in the automotive world, the horsepower to weight ratio indicates how responsive a car might be. The pump world has its own set of terms which are used to classify pumps of different sizes and shapes. Unfortunately, pump terms tend to be somewhat abstract.One of the widely used pump design numbers is the Impeller Specific Speed (sometimes called “Pump Specific Speed” or “Specific Speed”). In a recent bulletin we discussed how efficiency gains from reducing wear ring clearance with Vespel® CR-6100 were related to impeller specific speed. Today, we’ll take a closer look at what impeller specific speed defines and how it relates to the pump efficiency gains from reduced wear ring clearance.Impeller Specific Speed (Ns)The impeller specific speed defines the shape of an impeller in terms of flow rate vs. head. Does the impeller put up a lot of head and low flow, or does it produce a lot of flow at low head?Cameron Hydraulic Data defines Impeller Specific Speed as “the speed at which an impeller, geometrically similar to the one under consideration, would run if it were reduced in size to deliver one gpm at one foot of head.” That is a really tough definition to conceptualize. It is far easier to look at the impeller shape. Most pump design texts will have a diagram similar to Figure 1:


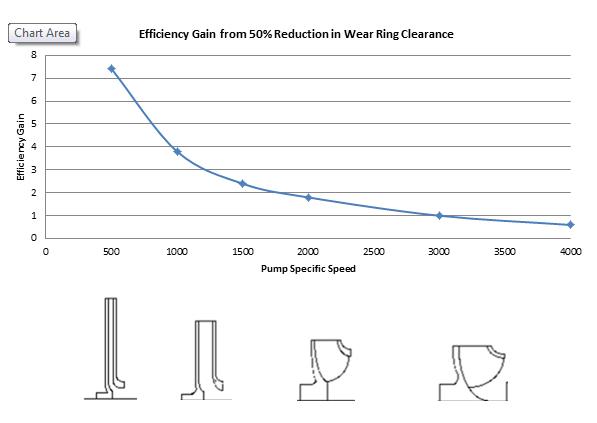
 Figure 3: Efficiency gain from reduced clearance by impeller shape and specific speedIn pumps with very low impeller specific speed, we have the opportunity to increase efficiency by 4% or more. For the more common process pumps, we can increase efficiency by 2-4%. For high-flow, low-head pumps, the efficiency gains become smaller.ConclusionTaken alone, the efficiency gains noted above offer a significant economic justification for a program to upgrade pumps to Vespel® CR-6100. Pumps with impeller specific speed values less than 2000—basically all of your process pumps—will offer a good return. Depending on the price of power at your plant, the payout will range from about 3 years for locations with very cheap power ($0.04/kwh) to less than a year for locations with more expensive power ($0.12/kwh or more). Please feel free to get in touch with Boulden if you would like for us to share the details of this calculations with you.

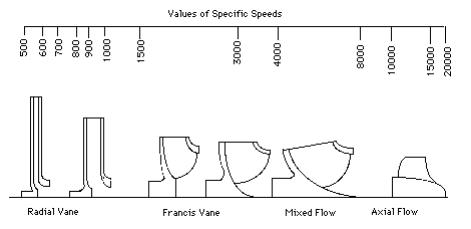
Figure 1: Impeller shape compared to specific speed – Source: www.McNallyInstitute.com
Impellers with a large ratio of outside diameter to impeller eye and narrow vanes produce low specific speed numbers. This type of impeller is typical in high pressure charge pumps and boiler feed water pumps. At the other end of the spectrum, large, open impellers where the outside diameter is only slightly larger than the impeller eye produce high specific speed numbers. This type of impeller is typical in cooling water pumps.We can calculate the impeller specific speed with the following formula:
RPM – rotations per minute; GPM – U.S. gallons per minute flow at BEP (best efficiency point); H – Pump head (per stage) in feet at BEP
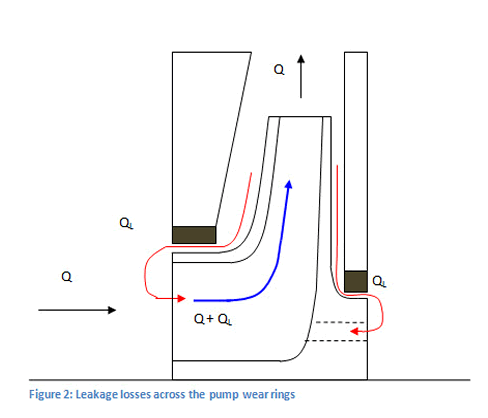
How does this relate to the wear ring clearance and efficiency?The wear ring clearance impacts pump efficiency because the wear rings control the volume of internal recirculation from high pressure to low pressure areas within the pump. Figure 2 shows the leakage flow (QL) across the wear rings of a single-stage pump impeller with balance holes.
Figure 2: Leakage losses across the pump wear rings
Now, consider the impeller shapes in the impeller specific speed diagram. The low specific speed impeller is creating a large amount of head and low flow rates. This design will create a large differential pressure across the wear rings, resulting in significant leakage. Also consider that the flow through the pump, Q, is relatively low. Therefore, the leakage across the wear rings will be a large factor in pump efficiency.In contrast, consider a high specific speed impeller, like your cooling water pump. There is a massive flow rate through the pump and the differential pressure across the wear rings is modest. Therefore, the leakage across the wear rings will play a much smaller role in pump efficiency.How much efficiency do we gain from reducing wear ring clearance?Putting it all together, we create Figure 3, which shows the efficiency gain as a function of impeller specific speed, with the shapes of the impellers across the bottom of the diagram. Figure 3: Efficiency gain from reduced clearance by impeller shape and specific speedIn pumps with very low impeller specific speed, we have the opportunity to increase efficiency by 4% or more. For the more common process pumps, we can increase efficiency by 2-4%. For high-flow, low-head pumps, the efficiency gains become smaller.ConclusionTaken alone, the efficiency gains noted above offer a significant economic justification for a program to upgrade pumps to Vespel® CR-6100. Pumps with impeller specific speed values less than 2000—basically all of your process pumps—will offer a good return. Depending on the price of power at your plant, the payout will range from about 3 years for locations with very cheap power ($0.04/kwh) to less than a year for locations with more expensive power ($0.12/kwh or more). Please feel free to get in touch with Boulden if you would like for us to share the details of this calculations with you.